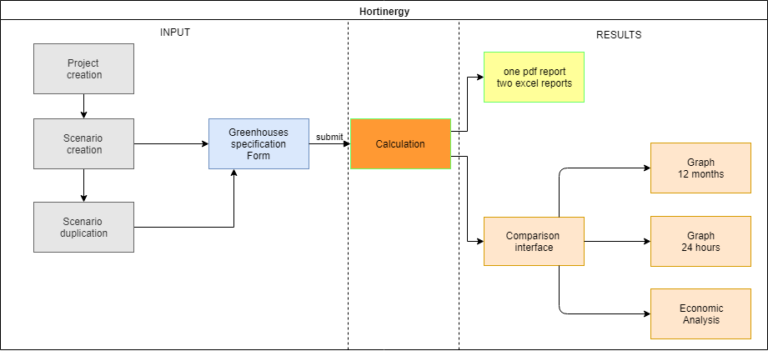
The picture below shows how Hortinergy works :


You start by entering the characteristics of your project online. After 20 minutes of calculation by our servers, you receive the results with :
A complete detailed PDF report,
An Excel file with hourly-based data for a full representative year,
An Excel file with daily-based average data for each month.
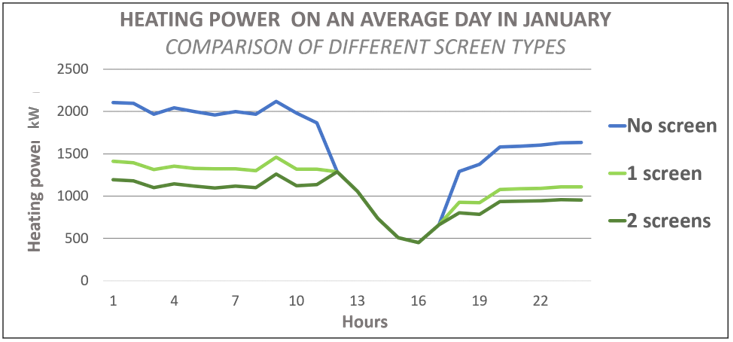
You can compare different scenarios online. For example, here is the comparison of the hourly heating power according to the number of screens on an average day in January.

Find out more about how Hortinergy works.

Comments are closed.